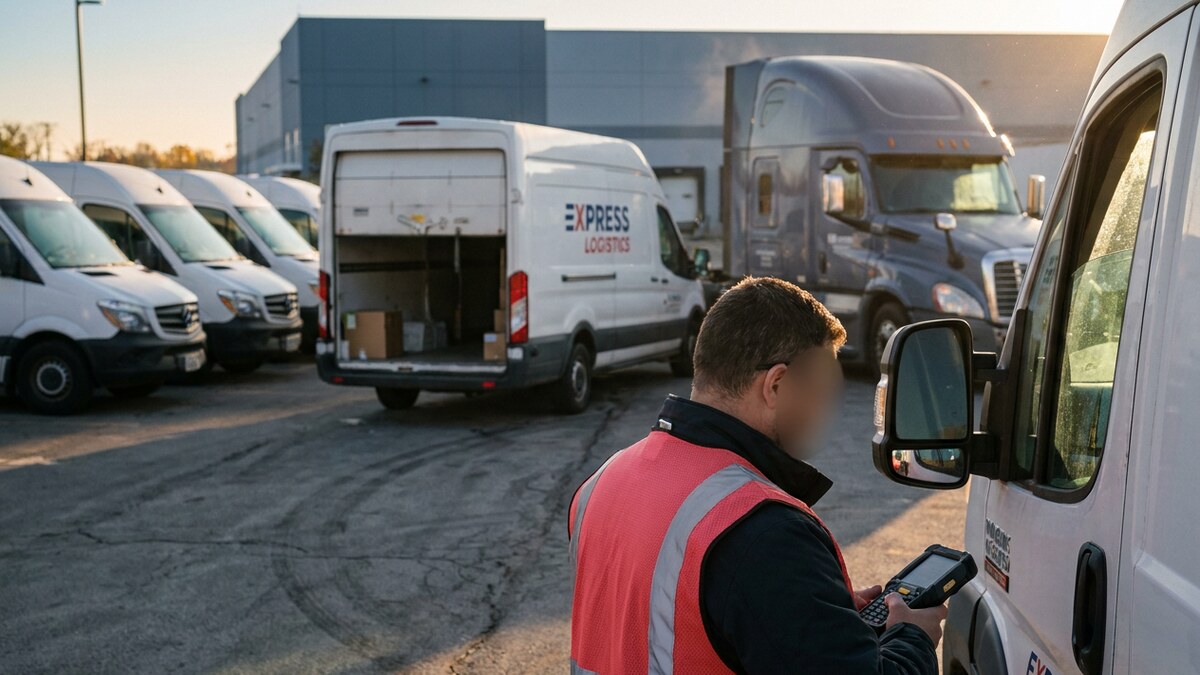

Manufacturers and enterprise logistics teams are swapping single-use cardboard and shrink wrap for durable, standardized containers. The switch stabilizes procurement costs and feeds the automated material handling modern plants run on. Grand View Research values the global returnable packaging market at USD 128.9 billion in 2025 and projects USD 206.2 billion by 2033, a 6.1 percent compound annual growth rate.
The workhorses are intermediate bulk containers, custom metal racks, and heavy-duty plastic pallets. Each one protects valuable components in transit and cuts material spend trip after trip.
A large reusable fleet also creates a new exposure: the assets walk. Verisk CargoNet recorded 3,625 cargo theft incidents across the United States and Canada in 2024, with an average estimated value of $202,364 per theft. Theft is only part of the bill.
McKinsey Global Institute research found companies absorb a supply chain disruption lasting a month or longer every 3.7 years, with losses equal to almost 45 percent of one year’s profits over the course of a decade. Replacing lost containers erases the savings that justified the program. That math is why operations leaders now tag the container itself and route the data into real-time supply chain visibility.
Key Takeaways
- Enterprises buy durable transport packaging to lock in predictable procurement costs, a lower cost per trip, and reportable circular economy progress.
- Untracked containers vanish into third-party yards, scrap channels, and supplier storage racks, forcing emergency replacement buys.
- Automated storage and retrieval systems demand rigid, dimensionally consistent containers that will not warp or crush.
- Multi-sensor tracking turns a passive container fleet into reporting nodes with location, dwell time, and utilization data.
The Hidden Blind Spots in Reusable Asset Networks
Reusable transport items only pay off inside a tightly controlled closed loop. Treat them like disposable packaging and the financial case collapses fast. Six failures show up again and again:
- Shrinkage and outright loss: High-value IBCs and custom metal dunnage disappear into third-party warehouses or get sold for scrap. Asset owners then pay rush pricing on replacement stock to keep lines running.
- Downstream hoarding: Suppliers and regional distributors keep premium pallets and heavy-duty totes for their own storage instead of returning them. Cycle times stall and the pool looks short when it is not.
- Reverse logistics spend: Empty containers do not ship themselves home. Backhaul freight, washing, and repair eat a real share of the per-trip savings, and unmanaged empty miles turn a profitable pool into a break-even one.
- Cross-border holdups: Empty reusable containers still clear customs. Pools cycling between the United States, Mexico, and Canada sit at the border while paperwork treats them as goods rather than equipment, stranding assets for days at a time.
- Manual audit gaps: Barcode scans and clipboard counts at the dock miss assets constantly. One skipped scan and the system loses the container until someone walks the yard weeks later.
- Idle inventory: Containers sit empty in dead corners of sprawling industrial yards. Without utilization data, fleet managers overbuy and tie up capital in assets they already own.
Integration is the constraint that decides whether the other five get solved. Sensor data that never reaches the ERP or warehouse management system your planners already work in becomes a second screen nobody opens. Container telemetry earns its keep when it lands inside the systems that trigger replenishment and release trailers, so API depth and pre-built connectors matter as much as tag accuracy.
What Is Driving Market Growth
Cost control is the strongest driver. Timber and paper markets move unpredictably, which makes single-use packaging a moving target on every budget cycle. Heavy-duty plastic and fabricated steel containers cost more upfront but hold a fixed cost per trip across five to ten years of service. Finance teams in automotive manufacturing and commercial agriculture take that predictability every time.
ESG compliance and circular economy mandates drive adoption just as hard. Jurisdictions across North America and Europe cap landfill contributions from commercial operations and enforce reporting against them, and corporate sustainability disclosures now carry packaging waste as a reported line item rather than a footnote. A closed-loop packaging model satisfies those requirements and sidesteps rising disposal fees.
Automation sets the specifications. Automated storage and retrieval systems need uniform dimensions and consistent weight distribution on every unit. Warped wooden pallets and crushed cartons jam conveyors and shut down lines. Molded plastic and welded metal containers keep the robotics running.
Core Segments Within the Returnable Packaging Market
The market splits into distinct product categories matched to cargo type. Pallets carry the largest share as the base layer under most heavy freight. Intermediate bulk containers own the chemical and liquid food segments on volume capacity and integrated discharge valves. Crates and totes serve high-speed piece picking and pharmaceutical distribution, while custom dunnage secures fragile aerospace and automotive parts inside larger containers.
Material follows the operating environment. High-density polyethylene and polypropylene lead on moisture resistance and strength-to-weight ratio. Steel and aluminum handle engine blocks, transmissions, and heavy machinery parts where structural integrity decides everything. Wood still holds share but keeps losing ground to plastics that will not splinter, absorb pathogens, or require fumigation for international shipments.
Automotive OEMs depend on custom metal racks moving transmissions and stamped body panels between suppliers and assembly. Those racks are built to tight tolerances, so one missing rack stops the supplier from shipping and threatens the plant schedule. In food and beverage, sanitation drives the choice: molded plastic resists moisture, gives bacteria nowhere to hide, and survives high-pressure chemical washdowns.
Connecting the Fleet with Asset Intelligence
Buying durable containers is step one. Knowing where every one of them sits is what returns the money. That gap is driving fast growth in IoT-enabled returnable transport item (RTI) tracking.
Operators mount ruggedized sensors directly on high-value pallets and IBCs. Those sensors report over cellular, satellite, and Bluetooth Low Energy, so coverage holds from the interstate to the back of the building. Passive plastic and steel become reporting nodes in the network.
Integration multiplies the value. Feed container location into yard management and spotters know exactly which trailers hold empties ready to process, which ends the manual yard hunt and speeds trailer turns. Route the same feed into delivery tracking and customers get predictive ETAs based on where the container actually is.
Security runs on the same data. Operators draw geofences around approved plants and transit hubs, and an unauthorized departure triggers an alert the operations team can act on immediately. When an IBC leaves its zone at 2 a.m., somebody knows before the shift ends.
What Comes Next: From Container Tracking to Autonomous Control
The next shift is from passive tracking to AI-driven reverse logistics and predictive asset intelligence. Instead of reading a map, the platform flags the hoarding supplier, sizes the shortfall, and recommends the rebalancing move before production feels it. That is the autonomous control tower enterprise supply chain leaders are building toward, and container fleets are the easiest place to prove it.
Modern logistics teams treat tracking as an intelligence layer, not a status page. The operations leaders we work with consistently report the turning point arrives at scale: across 246,000 returnable containers tracked, the value shifts from finding individual assets to running the pool tighter with fewer of them.
Match the Platform to the Containers You Cannot Afford to Lose
Your platform choice decides whether the reusable packaging program pays. Start with connectivity. A GPS-only device fails indoors and in dense urban cores, so look for GPS, cellular LTE-M, and BLE working together from the highway into the deepest aisle.
| Platform | Networks | Best For | Starting Price | Key Strength |
|---|---|---|---|---|
| GPX Intelligence | Cellular + BLE + GPS + Satellite | Universal asset & fleet tracking | As low as $45/yr per tag, hardware included | AI-powered tracking with multi-network connectivity |
| Samsara | Cellular | Fleet management & driver safety | Not listed publicly | Driver-safety dashcam integration |
| Motive | Cellular | Trucking ELD & compliance | Not listed publicly | DOT-compliance ELD workflow |
| Verizon Connect | Cellular | Mid-market fleet management | Not listed publicly | Carrier-backed connectivity bundle |
Next, judge the analytics. Raw location pings without context just move the spreadsheet problem into a new tab. Scout AI answers plain-English questions such as which site holds the most idle containers, so planners catch hoarding and shortfalls before production feels them.
Then check hardware range. A custom engine rack worth roughly $5,000 earns a rugged, multi-year battery device. A $50 plastic tote does not. Your provider needs peel-and-stick disposable tags for low-tier assets alongside enterprise hardware, or you will overspend your way out of full coverage.
Turn your reusable packaging network from a blind spot into an advantage. See how returnable container tracking works on a live pool, or get pricing for your containers.
Frequently Asked Questions (FAQs)
How big is the returnable packaging market and how fast is it growing?
Grand View Research values the global market at USD 128.9 billion in 2025 and forecasts USD 206.2 billion by 2033, growing about 6.1 percent a year. Growth tracks industrial output, automation investment, and circular economy regulation rather than consumer demand. Pallets hold the largest product share, with intermediate bulk containers concentrated in chemical and liquid food supply chains.
How do companies track returnable containers indoors and in transit?
They tag the container itself. AssetTag Pro reports indoors over BLE and runs up to 3 years (up to 5 on AssetTag Pro Max), with no charging, as low as $45/yr per tag with the hardware included. Cellular and satellite trackers cover over-the-road movement, and SmartLabel handles one-way shipments as low as $13 per label, with no wiring, charging or reverse logistics.
How do you stop downstream partners from hoarding returnable containers?
Measure dwell time per location and put the numbers in front of the partner. Tagged containers show exactly how long each site holds assets past the agreed return window, which turns a dispute into a data conversation. Most operators pair dwell reporting with geofence alerts so a container that never leaves a supplier yard surfaces in days instead of quarters.
What is the typical ROI for tracking returnable packaging with IoT sensors?
The first-order return is the ratio of tag cost to asset value. An AssetTag Pro at as low as $45/yr, hardware included, pays for itself the first time it stops a rush replacement buy on a metal rack worth thousands. The larger return arrives later: dwell and utilization data let operators run the same production schedule on a smaller container pool, which releases capital already committed.
How do returnable transport items (RTIs) support circular economy and ESG goals?
Reusable containers keep packaging material inside a closed loop instead of a waste stream, which is the working definition of a circular economy in logistics. Tracking makes that claim auditable: trip counts per container, service life, and recovery rate turn a sustainability statement into a reported figure. Enterprise customers and regulators now ask for the evidence rather than the intent.
Can container tracking data feed our existing ERP, WMS, or TMS?
Yes, and that integration is what separates a useful deployment from a second dashboard nobody opens. Look for documented APIs and pre-built connectors into ERP, warehouse management, transportation management, and yard management systems. GPX is platform-agnostic, and Scout AI queries the same data in plain English without a separate report builder.