
The global returnable packaging market was valued at USD 122.06 billion in 2025 and is forecast to reach USD 218.96 billion by 2032 at an 8.70% CAGR, driven by sustainability mandates, EPR regulations, and the rising cost of one-way packaging. Yet the same fleets that should be a competitive advantage are quietly bleeding value: the Reusable Packaging Association and Deloitte data show automotive losing 15 to 20 percent of returnable pallets and lids annually, with plastic pallet and container loss across the U.S. running between $800 million and $1.5 billion a year.
If your business ships parts, finished goods, components, or bulk materials on reusable assets, this guide walks through what a returnable container actually is, the main types in active circulation, how returnable container programs work, why so many of them lose money, and how to choose the right tracking solution in 2026.
What Is a Returnable Container (RTI)? Definition and Circular Economy Impact
A returnable container is a durable, reusable shipping asset designed for multiple trips through a supply chain. Instead of being thrown away after one use like a corrugated cardboard box, a returnable container is shipped out with product, emptied at the destination, and sent back to the originating plant or pool operator to be cleaned, inspected, and reloaded. The category is also known as returnable transport items (RTI), returnable transport packaging (RTP), reusable transport packaging, or simply reusables. In a circular supply chain ecosystem, returnable containers are the physical layer that makes circularity work at industrial scale.
Returnable containers replace single-use packaging with a closed-loop or pooled-loop alternative. They are typically built from injection-molded plastic, structural foam, corrugated plastic, steel, or wood, and engineered to survive between 10 and 500 trip cycles depending on the design. The defining characteristics are simple:
- Durable construction that holds up to repeated handling, stacking, washing, and rough transit conditions.
- Standardized dimensions that nest, stack, fold, or rack to maximize cube utilization on outbound and return trips.
- Designed for reverse logistics, with collapsibility, nestability, or fold-flat features that reduce return-trip freight cost.
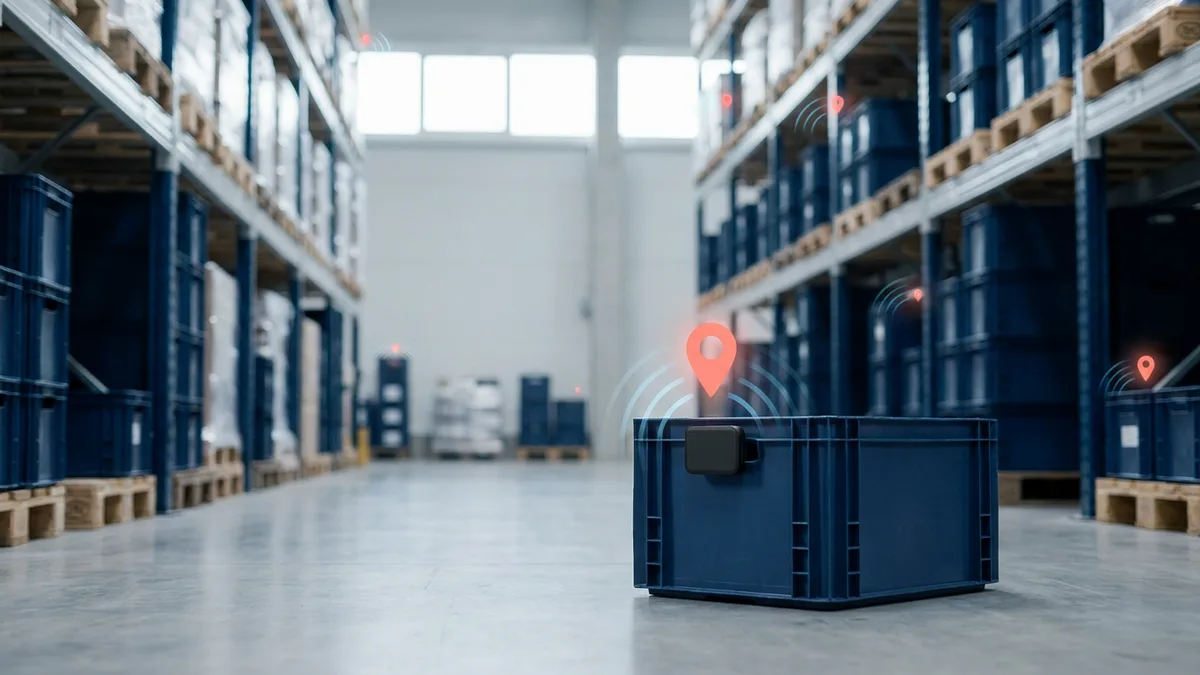
- Identifiable, with labels, barcodes, RFID tags, or BLE asset tags that make ownership, location, and trip history trackable.
Common synonyms you may run into in procurement specs, RFPs, and supplier agreements include returnable shipping containers (RSCs), regular slotted containers, reusable bins, durable transport packaging, returnable racks, circular packaging, and pool containers. You will also see specialized product families like Pallet Sleeve Systems (a pallet base plus a collapsible sleeve plus a lid) and FLCs (Foldable Large Containers) that fold flat for empty-leg transport. Modern designs often include auto-lock top and auto-lock bottom mechanisms that cut loading and unloading labor. They all describe the same operating model: ship, return, reuse.
Returnable Containers vs Single-Use Packaging: Total Cost of Ownership (TCO) and ESG ROI
The case for returnable containers is usually framed as a sustainability story, and the environmental math is genuinely strong. But the operational and financial case is what gets these programs funded inside Fortune 500 supply chains.
- Lower total cost of ownership. A returnable container typically pays back its higher unit cost within 10 to 30 trips compared to single-use corrugate, after which every additional trip is essentially free packaging.
- Reduced damage rates. Rigid plastic totes, dunnage trays, and custom racks cradle parts in a way cardboard cannot, cutting in-transit damage and warranty claims on sensitive components.
- Less waste handling. Receiving plants spend less labor on breaking down boxes, baling cardboard, and managing dumpster pulls.
- Better cube utilization. Standardized footprints align with automated material handling, AS/RS systems, and AGV traffic patterns.
- Scope 3 emissions reductions. Each reuse cycle avoids the embodied carbon of producing, transporting, and disposing of single-use packaging, a measurable line item on corporate ESG reports.
The trade-off is that returnable containers carry a higher unit price, require reverse logistics infrastructure, and only deliver ROI if they actually come back. That last point is where most programs quietly leak money, and it is the operational reality that makes returnable container tracking the most important capability in any RTP program.
Top Types of Returnable Containers Used in 2026 Supply Chains
Returnable containers are not a single product. They are a category that spans dozens of form factors, sized to the asset class they carry. Below are the main types you will encounter across automotive, healthcare, food and beverage, construction, and industrial supply chains.
| Container Type | Typical Use Case | Industries |
|---|---|---|
| Reusable Pallets | Unit load transport between plants, DCs, and customers. Wood, plastic (HDPE/PP), or composite. | Automotive, food and beverage, retail, consumer goods |
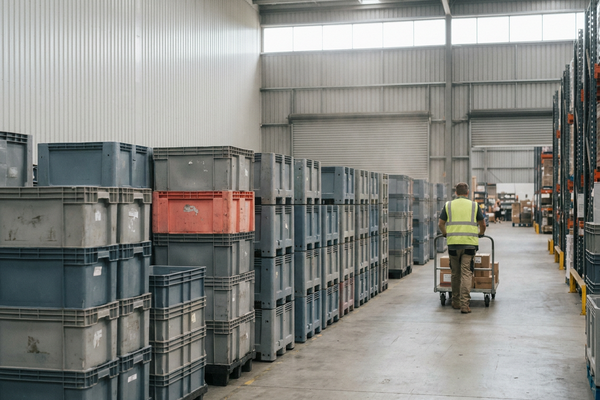
| Plastic Totes and Bins | Small parts, sub-assemblies, e-commerce returns, kitting. Often nestable or stackable. | Automotive, electronics, e-commerce, pharmaceuticals |
| Intermediate Bulk Containers (IBCs) | Bulk liquids, granulates, chemicals, food ingredients. Caged or rigid composite. | Chemicals, food processing, pharmaceuticals, paints and coatings |
| Custom Steel Racks and Stillages | Body panels, large stamped parts, sequenced JIT components, fragile assemblies. | Automotive Tier 1, aerospace, heavy equipment |
| Dunnage and Inserts | Custom-formed protection that cradles individual parts inside a rack or tote. | Automotive, medical device, electronics |
| Drums and Kegs | Beverages, lubricants, chemicals, industrial fluids. Steel or plastic. | Beverage, oil and gas, chemicals |
| Collapsible Bulk Containers (FLCs) | High-volume parts and components. Foldable Large Containers collapse flat for empty return. | Automotive, appliance, agriculture, electronics |
| Pallet Sleeve Systems | A pallet base plus collapsible sleeve plus lid. Highly customizable, fold-flat return. | Automotive, retail, pharmaceuticals, electronics |
| Reusable Crates and RSCs | Returnable Shipping Containers including regular slotted designs with auto-lock tops and bottoms. | Food and beverage, grocery, agriculture, retail distribution |
| Gas Cylinders and Specialty Vessels | High-value pressurized containers ($300 to $15,000 per unit) for industrial gases, chemicals, and specialty fluids. | Industrial gas, chemicals, healthcare, welding supply |
Pallets and crates together account for roughly 65 percent of deployed returnable packaging globally, with IBCs the fastest-growing segment thanks to expanding chemical and food ingredient trade. Foldable Large Containers and Pallet Sleeve Systems are gaining share rapidly in automotive and electronics for their fold-flat return economics and customizable inserts.
RTI Management Workflows: Closed-Loop vs Open-Loop Pooling Models
Returnable container programs come in two structural models. Knowing which one applies to your business changes the economics, the tracking requirements, and the supplier governance you need.
Closed-loop programs circulate containers within a tightly defined network, typically between a manufacturer and a known set of tier-one suppliers or distribution centers. The originating company owns the fleet, pays for the freight back, and bears the loss when a container goes missing. Most automotive Tier 1 to OEM programs are closed-loop. So are most healthcare medical device deployments where a finite hospital network returns sterilization cases.
Open-loop or pooled programs are run by third-party pool operators like CHEP, PECO, iGPS, IFCO, and Tosca, who own the containers and rent them by trip or by day. Pallets and grocery crates dominate this model. The pool operator handles cleaning, repair, and redistribution, and charges members a per-trip or rental fee. Losses are absorbed into the pool fee structure.
Both models share the same operating cycle:
- Container is filled with product at the originating facility.
- Outbound shipment moves to the receiving facility or customer.
- Container is unloaded, often staged in a return queue.
- Empty containers consolidate into a return shipment.
- Containers return to a wash and inspection hub.
- Cleaned, inspected containers reenter circulation.
The bottleneck is almost always step 3 and step 4. Containers sit in supplier yards, customer dock zones, or transit terminals for days or weeks longer than the return contract specifies. The longer the dwell, the larger the fleet you have to own just to keep production fed.
Overcoming Reverse Logistics Pain Points: Fixing the Supply Chain Black Hole
Every returnable container program is, by definition, a reverse logistics program. Reverse logistics is the process of moving goods, packaging, or assets back through the supply chain after they have been used or delivered. For returnable containers, the reverse leg is where the program either creates value or quietly destroys it.
Logistics teams typically break reverse logistics into four categories, and returnable containers touch all four:
- Brick-and-mortar returns. Containers come back from retail stores, distribution centers, or hospitals to a central hub.
- Secondary market flow. Containers that are no longer needed in the primary loop get redistributed, refurbished, or sold into adjacent markets.
- Reusability, repair, and remanufacturing. Damaged containers go to repair stations. End-of-life units enter remanufacturing or recycling streams.
- Customer returns and recalls. Returnable containers are the vehicle for moving recalled product or warranty returns back to the originating facility, with full chain of custody preserved.
The common failure pattern in reverse logistics is the same one that plagues returnable container fleets: a lack of visibility once the container leaves the originating facility. Manual reconciliation, spreadsheet-based audits, and supplier self-reporting introduce error rates north of 5 percent and labor costs that compound month over month. The companies that win the reverse logistics game are the ones that instrument their containers, automate the audit, and replace human counting with sensor-generated truth. That is exactly the operational shift that returnable container tracking enables.
Which Industries Rely on Returnable Container Tracking the Most?
Returnable containers show up across every physical supply chain, but the operational and financial stakes are highest in a handful of verticals.
- Automotive. Sequenced JIT parts move in custom steel racks, totes, and dunnage trays between Tier 1 suppliers and OEM assembly plants. A single missing rack of body panels can trigger a line-down event that costs five to seven figures per hour. Automotive is the heaviest user of high-value custom returnable containers globally.
- Aerospace and defense. Precision components, avionics modules, and specialty fabrications move in highly customized racks and ESD-protected totes between Tier 1, Tier 2, and prime contractor facilities. Chain-of-custody documentation is a contractual and compliance requirement, not a nice-to-have.
- Healthcare and medical device. Sterilization cases, reusable surgical instrument trays, and pharmaceutical totes circulate between hospitals, surgery centers, and reprocessing facilities. Loss carries direct patient-safety and compliance consequences, not just financial cost.
- Construction. Tool boxes, equipment crates, formwork hardware bins, and custom fabrication racks move between yards, job sites, and sub-contractor locations. Theft and misplaced returnables on active sites are a recurring drag on project margins.
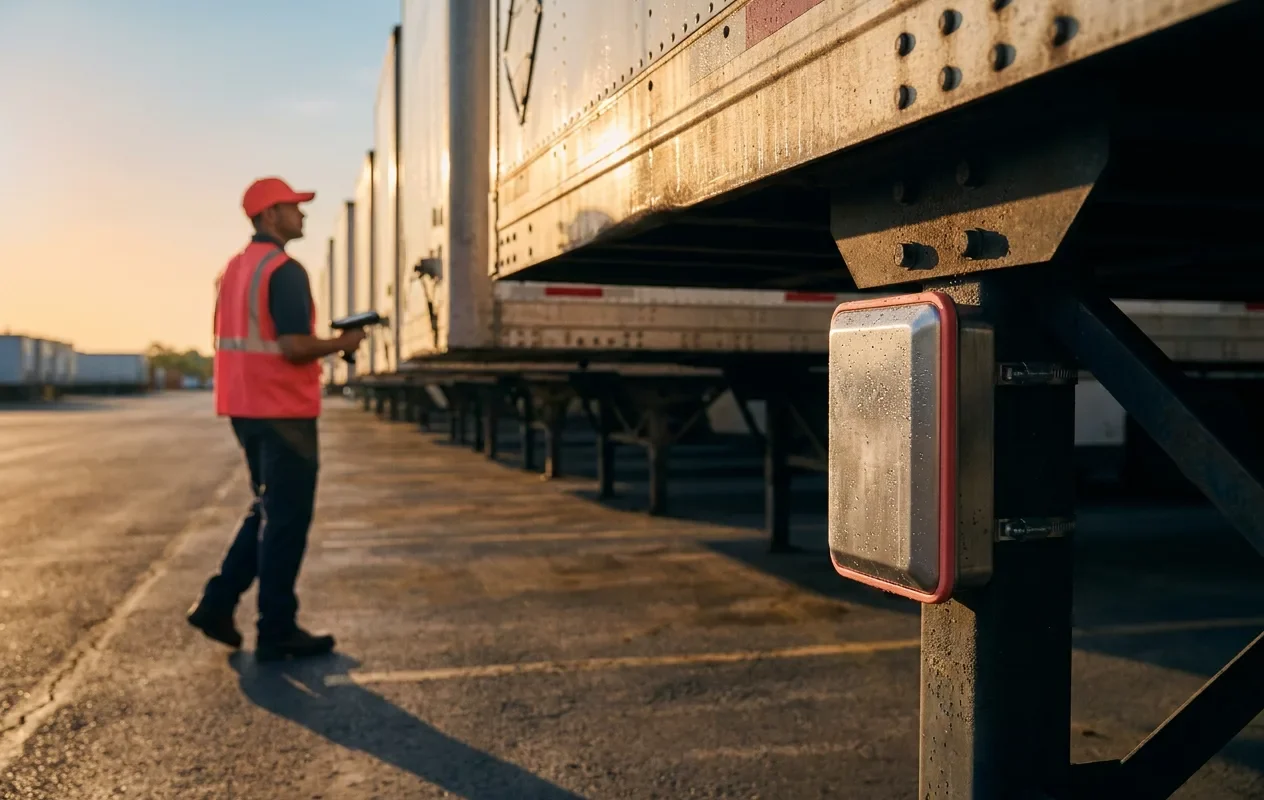
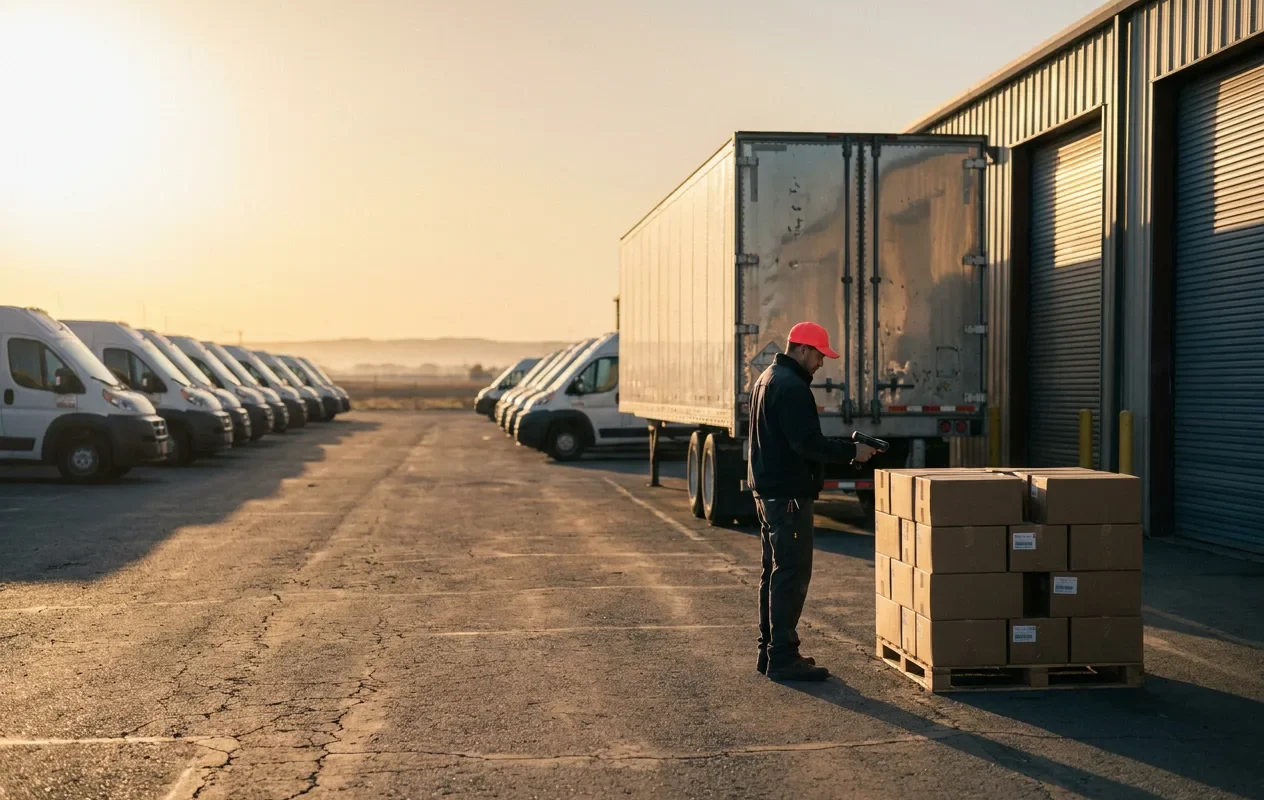
- Fleet and in-transit logistics. 3PLs, dedicated fleet operators, and yard managers handle thousands of returnable assets simultaneously, including chassis, intermodal containers, gaylords, and trailer-resident totes. Yard operations are where most returnable container dwell time accumulates unnoticed.
- Industrial gas and specialty chemicals. Gas cylinders and chemical containers run from $300 to $15,000 per unit, with safety and inspection records tied to each individual serial number. Lost cylinders are not just a financial write-off, they are a compliance liability.
- Food and beverage. Reusable plastic crates, milk crates, beer kegs, and dairy totes circulate between processors, distributors, and retailers. Beer keg losses alone total over $52 million annually in the U.S.
- Agriculture. Harvest bins, totes, and field crates move between growers, packers, and distributors with very tight seasonal windows.
The common thread: any business that owns a fleet of physical assets that should come back but sometimes does not is running a returnable container program, whether they call it that or not.
The Shrinkage Crisis: Why Unmonitored Returnable Container Fleets Lose Up to 20% Annually
Returnable container loss is one of the most under-counted line items on a logistics budget. It rarely shows up as a single number on a P&L, which is exactly why it gets to grow unchecked. The Reusable Packaging Association documents typical loss rates of 5 to 15 percent annually on uninstrumented fleets, with the Center for Automotive Research benchmark sitting around 7 percent. Deloitte’s automotive data ranges higher, at 15 to 20 percent for pallets and lids.
The reasons are almost always the same:
- Supplier yard dwell. A custom rack arrives at a Tier 1 supplier and sits for weeks past its return contract because nobody on either side is actively tracking it.
- Lost to attrition. Containers get rerouted, repurposed for storage at the receiving facility, or end up at a salvage yard.
- Theft and resale. High-value steel racks, plastic pallets, and metal IBCs have a recognizable resale value to scrap and grey-market buyers.
- Damaged and quietly retired. A cracked tote gets thrown away without a write-off entry, distorting the fleet count.
- Inter-plant cannibalization. One plant pulls containers from another to keep its own line running, breaking the count for both.
- Expedite freight to cover the shortfall. When containers do not come back in time, the response is usually emergency air freight or dedicated truckloads of replacement containers, a cost that often dwarfs the container value itself.
The real cost is not the replacement container. It is the chain reaction. A missing rack of sequenced parts triggers a line-down event. The line-down event triggers expedited freight, premium overtime, and contractual penalties. The plant orders replacement containers as a hedge, which inflates working capital tied up in idle inventory. Over a year, a 10,000-unit fleet of $250 custom racks can quietly consume $1 million to $3 million in direct and indirect costs that no single budget line catches.
The 2026 reality check. Three forces have raised the stakes on container loss in the current operating environment, and any blog covering this topic in 2026 has to call them out by name:
- Line-down events now cost $10,000 or more per minute. A missing rack of sequenced JIT parts at an automotive assembly plant does not cost $500 worth of steel. It halts the line, and the per-minute cost of a stopped line at a modern OEM facility is measured in five figures before the first contract penalty even applies.
- The Tier 1 hoarding epidemic. During peak production seasons, Tier 1 suppliers routinely hold back returnable containers as an insurance policy against their own inbound supply uncertainty. The downstream OEM then has to backfill with emergency single-use packaging or buy duplicate fleets, and finance never sees the line item because the containers technically still “exist” in the system.
- EU PPWR enters legal force on 12 August 2026. The European Packaging and Packaging Waste Regulation (Regulation EU 2025/40) introduces binding reuse targets, recyclability grades, and Extended Producer Responsibility (EPR) requirements across all packaging placed on the EU market. Untracked returnable packaging is rapidly becoming a legal liability, not just an operational one, and any global supply chain that touches the EU has to demonstrate auditable reuse data starting in August.
2026 Asset Tracking Technology: BLE, GPS, RFID, UWB and Digital Twin Integration Compared
The good news: every one of the hidden costs above is solvable with the right tracking layer. The bad news: not all tracking technologies are equally suited to the returnable container problem. Below is the head-to-head comparison enterprise supply chain teams are running in 2026.
| Solution | Hardware Cost | Infrastructure Needed | Best For | Limitations |
|---|---|---|---|---|
| GPX AssetTag (BLE + Multi-Network Relay) | ~$9.75 per unit, 5-year replaceable battery | None. Peel-and-stick. Relays via the existing GPX phone and vehicle network. | High-volume returnable racks, totes, IBCs, custom containers across multi-supplier networks | BLE range requires a relay device in proximity periodically |
| Passive UHF RFID | $0.10 to $1 per tag | Dock-door portals, handheld readers at every transit point | Closed-loop single-site programs with fixed read points | Infrastructure capex per site. Reader gaps create blind spots. No location between reads. |
| Cellular GPS Trackers | $50 to $300 per unit plus monthly cellular fee | None, but cellular subscription per device | High-value, low-volume assets like trailers, chassis, and heavy equipment | Too expensive per unit for fleets of 5,000+ returnables. Battery life often under 2 years. |
| Wi-Fi RTLS | $15 to $50 per tag | Dense Wi-Fi access point coverage in every tracked location | Indoor-only programs at a single facility | Loses signal the moment a container leaves the four walls. No supplier-yard visibility. |
| UWB (Ultra Wideband) | $25 to $100 per tag | UWB anchors installed throughout the facility | Sub-meter precision indoors where exact zone-level location matters | Site-bound only. High infrastructure capex. Overkill for fleet-level visibility. |
| Barcode and Manual Scan | Pennies per label plus scanner cost | Trained labor at every scan point | Low-volume legacy programs | Manual error rates of 5 to 10 percent. No real-time visibility. No alerts. |
The shift in 2026 is decisive. According to industry data referenced in GPX Intelligence asset tracking deployments, AI-enabled tracking pushes shrinkage rates on instrumented returnable containers from the 5 to 15 percent historical band down below 2 percent, with leading automotive and pharmaceutical fleets capturing the 28 percent loss reduction figure consistently. Infrastructure-free BLE tracking has rewritten the per-unit economics for the asset class that previously defied affordable instrumentation, which is exactly why the largest automotive OEMs are now standardizing on it across their returnable rack networks.
Two concepts have emerged as the dividing line between basic and best-in-class returnable container programs:
- Serialized tracking. Rather than tracking containers as an aggregated pool (“we own 50,000 racks”), serialized tracking instruments each unit with a unique identifier and follows it across its entire trip history. The granular data this generates unlocks per-container cycle time analysis, supplier-specific dwell scorecards, end-of-life retirement decisions, and rapid recall capability. For high-value assets like gas cylinders and chemical containers, serialized tracking is not optional, it is a safety and compliance requirement.
- Black hole recovery. A returnable container fleet always has units that have quietly disappeared into customer or supplier facilities, sometimes for years. Comprehensive tracking surfaces these “black hole” assets, often recovering containers worth tens of thousands of dollars per site without any net new purchases. For some fleets, the first year of tracking deployment delivers more value from black hole recovery than from new-loss prevention.
Together, serialized tracking and chain-of-custody traceability convert returnable containers from a fluctuating liability into a measurable, managed asset class.
Three NextGen technology layers are reshaping what “tracked” means in 2026, and the leading-edge fleets are already operating with all three:
- Supply chain Digital Twins. Every BLE and GPS ping from a returnable container fleet streams into a live digital replica of the physical supply chain. Operations teams use the Digital Twin to simulate alternate routing, model the impact of a supplier delay, and pressure-test recovery plans before disruptions hit the production line.
- Predictive dwell-time analytics. Modern platforms like the GPX Scout AI layer do not just report where containers are. They forecast where each unit will be in the next 24 to 72 hours, flag suppliers tracking toward a dwell-time breach, and trigger automated geofence alerts and supplier penalty invoicing without a human in the loop.
- 5G edge computing in the yard. Inside automated yards, distribution centers, and OEM plants, 5G private networks paired with edge compute nodes cut the latency between a container scan and an action down to milliseconds. The result is faster gate-in, gate-out, and dock-door reconciliation cycles, which compresses the dwell time that drives most returnable container loss.
The Business Case: PPWR 2026 Compliance, Scope 3 Emissions, and Real-Time ROI
The financial return on a tracked returnable container program is one of the cleanest ROI stories in supply chain operations. Companies that move from manual reconciliation to IoT-based tracking typically see container loss rates drop from double digits to under 2 percent annually, with average first-year ROI in the 15x to 18x range across a portfolio of deployments. The savings stack across multiple lines:
- Shrinkage reduction. Continuous visibility and automated geofence alerts drive shrinkage below 2 percent.
- Expedite freight avoidance. Shortages are predicted hours in advance, not discovered at the line.
- Fleet right-sizing. Most companies discover they own more containers than they actually need, freeing working capital.
- Supplier dwell management. Automated alerts and supplier scorecards compress the average return cycle time.
- Reduced administrative overhead. Hours per week previously spent on manual container reconciliation collapse to near zero.
- Rental and rebill revenue uplift. For pooled fleets that bill per cycle, serialized tracking typically lifts rental revenue 3 to 5 percent by closing gaps where containers were in use but uninvoiced.
- Customer dispute elimination. Chain-of-custody data ends arguments about who has which containers, when they were delivered, and whether they came back. Relationships with key customers improve as a side effect.
- Safety, compliance, and recall readiness. Serialized records support hazardous materials inspections, regulatory audits, and rapid recall execution, where minutes of response time can prevent contamination events or regulatory penalties.
- Scope 3 emissions credit. Auditable reuse-cycle data feeds directly into ESG and sustainability reporting, replacing industry-average estimates auditors increasingly reject.
The sustainability story is the one boards now ask about by name. Each additional trip a returnable container completes avoids the embodied carbon of producing a single-use replacement, the transport emissions of shipping that replacement, and the disposal cost at end of life. For companies subject to EU Corporate Sustainability Reporting Directive (CSRD) requirements, U.S. SEC climate disclosure rules, or the new EU Packaging and Packaging Waste Regulation (PPWR) applying from 12 August 2026, tracked returnable container data is one of the few categories where Scope 3 emissions can be measured rather than estimated. The same data feeds Extended Producer Responsibility (EPR) reporting in every jurisdiction now standing up Deposit Refund Schemes (DRS) for packaging, which is increasingly the default policy direction across Europe and parts of North America.
How to Choose the Right Returnable Container Tracking Solution
If you are evaluating returnable container tracking for the first time, or replacing a program that has not scaled the way it was supposed to, the decision comes down to a short list of operational questions. Work through these in order before you sign a hardware contract.
- How many containers are in the fleet, and what is each one worth? If you have 10,000+ mid-value containers ($100 to $500 each), per-unit tracking economics matter more than feature breadth. Look for BLE asset tags in the sub-$15 range with multi-year battery life.
- How many locations does a container touch in a typical trip? Multi-site networks with several supplier locations will outgrow Wi-Fi RTLS and dock-door RFID quickly. Infrastructure-free tracking that does not require hardware at every node is the only model that scales.
- Do you need real-time location or just chain-of-custody events? Real-time GPS is overkill for most returnable assets. Periodic location refreshes from BLE relays usually deliver the operational outcomes (shortage prediction, dwell alerts, recovery) at a fraction of the per-unit cost.
- What is the integration path into your ERP, TMS, WMS, or fleet telematics platform? A tracking platform that cannot push events into SAP, Oracle NetSuite, Salesforce, your TMS, or your existing fleet telematics integration will create a parallel data silo nobody trusts. API-first architectures are the only practical option in 2026.
- What is your total cost of ownership over five years? Add hardware, software, infrastructure, battery replacement labor, and integration cost. Compare against the projected reduction in shrinkage, expedites, and working capital lockup. The ROI math should be clean enough to defend in a single page.
- Is the platform vertical-aware? Automotive cares about JIT sequence integrity. Healthcare cares about sterilization cycle tracking. Construction cares about job-site theft. Fleet operators care about yard dwell. The platform you choose should speak your vertical’s language out of the box.
Among the available options, the GPX Intelligence approach pairs the low-cost peel-and-stick GPX AssetTag with a multi-network relay platform and the Scout AI software layer, allowing operations and supply chain leaders to ask questions in plain English (“which racks are sitting past their return window at Supplier X?” or “what is our recovery rate on Program Y this quarter?”) and get answers backed by real telemetry. For automotive, construction, healthcare, aerospace and defense, fleet, in-transit logistics, and yard operations, the combination of low per-unit cost, 5-year replaceable battery, infrastructure-free deployment, and AI-driven analytics is what turns a returnable container program from a cost center into a managed asset class.
Once the platform decision is made, a three-step implementation roadmap reliably gets fleets from pilot to scale:
- Secure organizational buy-in. Returnable container tracking touches operations, supply chain, finance, sustainability, and IT. Pull all five into the room before the pilot. The fleets that scale fastest are the ones where the CFO and the supply chain VP are looking at the same dashboard.
- Plan the process before the technology. Map the current container flow, identify the highest-loss programs, define the events you actually need to capture (origin departure, supplier arrival, supplier dwell threshold, return arrival), and write the supplier compliance language into your contracts before the first tag goes on a container.
- Deploy the right tools on a pilot scope. Start with one high-value program or one plant. Instrument 100 percent of that scope, prove the loss reduction and dwell improvement numbers, and use those numbers to fund the enterprise rollout.
Returnable containers are no longer just packaging. They are working capital in motion, sustainability evidence on a balance sheet, and JIT continuity in physical form. Treat them that way, instrument them properly, and the ROI follows.
Frequently Asked Questions (FAQs)
What is the difference between RTI and RTP in supply chains?
Returnable Transport Items (RTI) and Returnable Transport Packaging (RTP) are largely synonymous in industry usage. RTP tends to describe the broader category of circular packaging, while RTI is more often used when referring to specific, serialized, trackable individual assets like a GPS-tagged pallet or a BLE-instrumented custom rack.
How does returnable packaging reduce Scope 3 emissions?
Returnable packaging eliminates the embodied carbon and disposal emissions of manufacturing single-use cardboard or plastic for every shipment. By using IoT tracking to prove multiple reuse cycles per container, companies can claim exact, auditable Scope 3 emissions reductions in ESG reports rather than relying on industry-average estimates.
What is the difference between a returnable container and reusable packaging?
The terms are used interchangeably in most supply chain contexts. Returnable container specifically emphasizes the closed-loop or pooled-loop return cycle, while reusable packaging is the broader category that includes any packaging designed for more than one use. In automotive and industrial supply chains, “returnable transport packaging” or RTP is the most common formal label, and includes pallets, totes, IBCs, custom racks, and dunnage.
How long does a typical returnable container last?
It depends on the construction and the operating environment. Plastic totes engineered for industrial use typically deliver 100 to 500 trip cycles before retirement. Custom steel racks can run for 10 to 20 years if maintained. Reusable wooden pallets average 25 to 30 trips. The economics break in favor of returnables once the unit completes about 10 to 30 cycles, depending on the alternative single-use cost.
How are returnable containers tracked across multi-supplier networks?
The 2026 standard for multi-supplier returnable container tracking is BLE asset tags relayed through an infrastructure-free network. The GPX AssetTag, for example, attaches to the container with adhesive, runs on a replaceable battery with a 5-year life, and broadcasts its identifier to a relay network of driver phones, plant worker phones, and vehicle hubs already in the supplier ecosystem. Visibility is automatic with no hardware install required at supplier sites, which is why infrastructure-free tracking has replaced fixed RFID portals for cross-network deployments.
What is the average ROI on a returnable container tracking program?
Industry deployments consistently report first-year ROI in the 15x to 18x range, driven primarily by shrinkage reduction (loss rates falling from 5 to 15 percent down to under 2 percent), expedite freight avoidance, and fleet right-sizing. The exact return depends on container unit value, fleet size, and the previous baseline loss rate, but the financial case typically pays back in the first six months of deployment.
How does reverse logistics relate to returnable container management?
Reverse logistics is the broader process of moving goods, packaging, and assets back through the supply chain after they have been used or delivered. Returnable container management is one of the most operationally significant applications of reverse logistics. The four reverse logistics flows that touch returnable containers are brick-and-mortar returns, secondary market redistribution, repair and remanufacturing, and customer returns or recalls. Strong reverse logistics performance depends almost entirely on container-level visibility, which is why IoT and BLE tracking have become standard in 2026 deployments.
Are returnable containers actually more sustainable than corrugated cardboard?
Yes, by a wide margin once you account for the full lifecycle. Multiple independent life cycle assessments show returnable plastic containers deliver lower cumulative carbon emissions, lower water use, and lower solid waste than single-use corrugated alternatives once they exceed roughly 10 to 20 use cycles. The sustainability benefit compounds further when containers are tracked, because tracked fleets achieve higher reuse rates, longer service lives, and lower replacement-manufacturing emissions.